This earthquake occured on Saturday 2 May 2020 at 12:51:05 UTC at 25.70°E – 34.14°N, ~95 km south of the town of Ierapetra
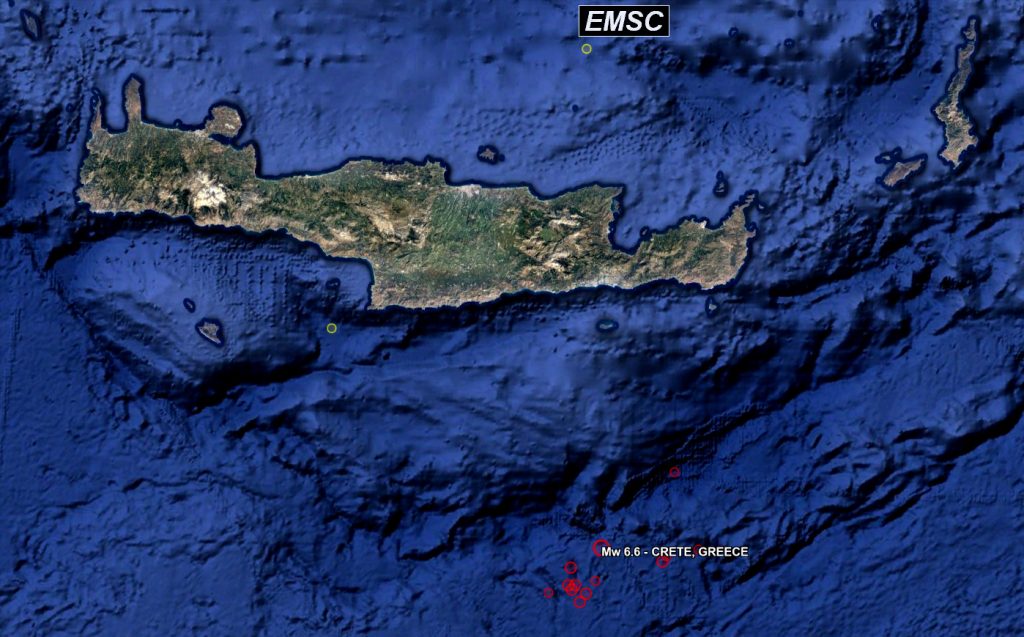
Figure 1: location of the earthquake
Download the list of the events of magnitude > 4 reported in the EMSC catalog for the four days 1-4 May 2020 and the area 24-27° / 33-36° (long/lat) in CSV format and KML (compressed) format
The focal mechanisms reported by EMSC indicate a low angle reverse fault at a shallow depth of 13.6 ± 6.4 km (average and r.m.s. scatter of the ten solutions).
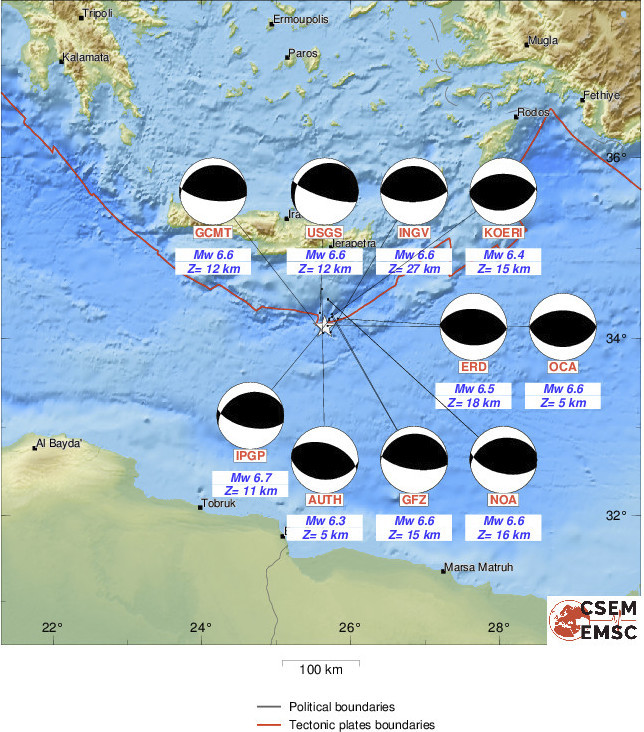
Figure 2: Focal mechanisms from various agencies
The GCMT parameters for the earthquake are Mw = 6.6, centroid depth 12.0 km, azimuth 257°, dip 24°, rake 71°, Mo = 1.01 1019 Nm
A small tsunami was observed at Ierapetra, see this video.
Figure 3: Video made at Ierapetra at the arrival time of the tsunami (youtube)
The tsunami was recorded by the tide gauge of Ierapetra (NOA-04) which is one of the tide gauges used by Hellenic National Tsunami Warning Centre (HL-NTWC) for the operational monitoring and tsunami alerts in Greece.

Figure 4: Sea level at the tide gauge of Ierapetra from ~9am UTC to ~11pm UTC
The data at 1 mn sampling rate can be downloaded from the NOA-04 tide gauge web page of here for the period 2020/05/02 00:00 – 2020/05/04 15:00. Click here to see the other tide gauge data available through the JRC web portal.
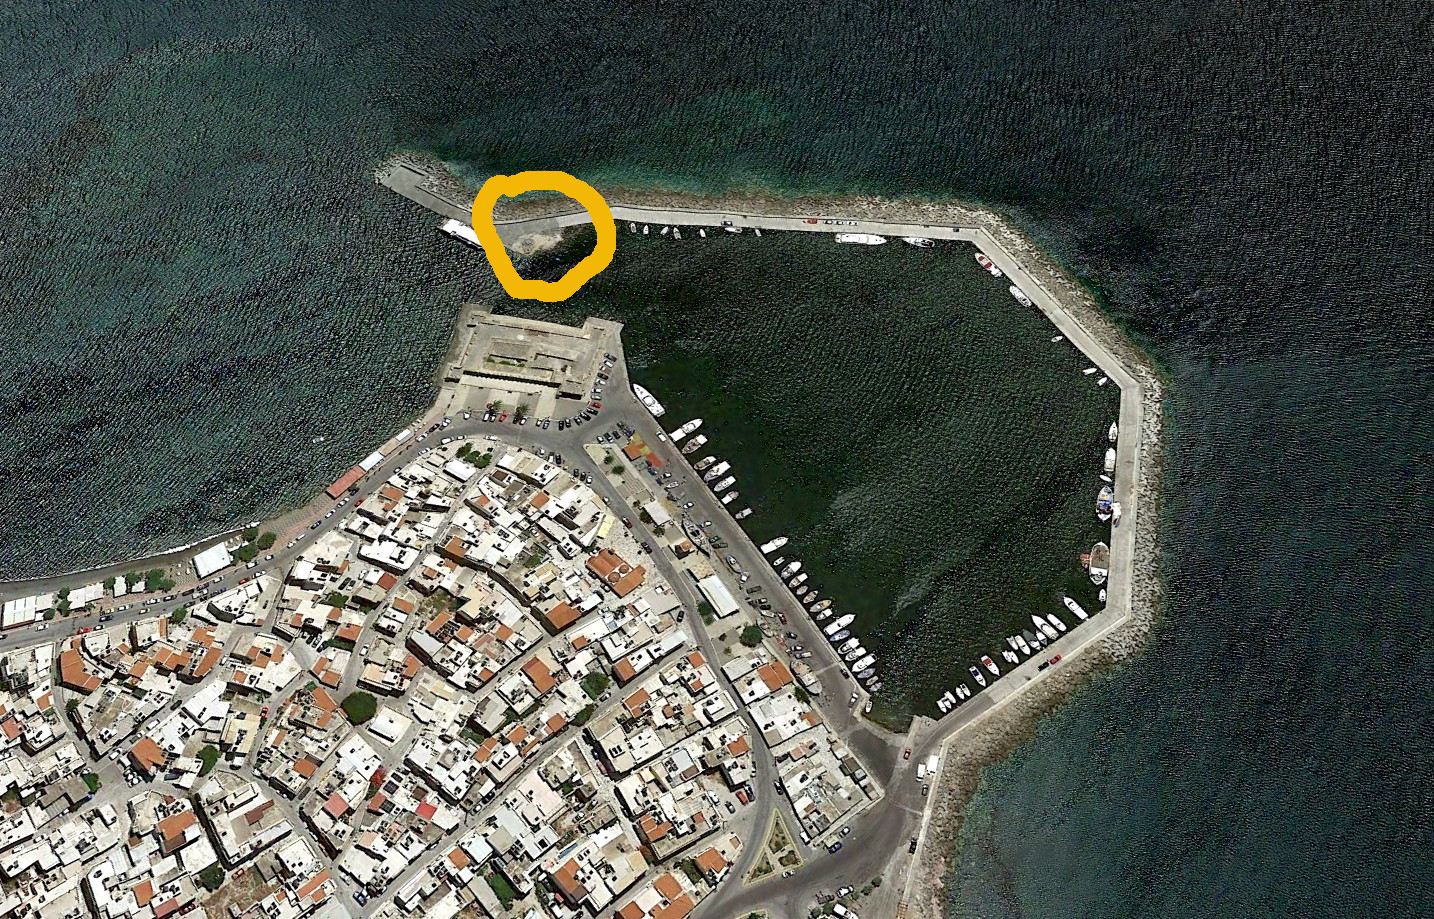
Figure 5: Location of the tide gauge guessed using the map provided by the JRC portal.
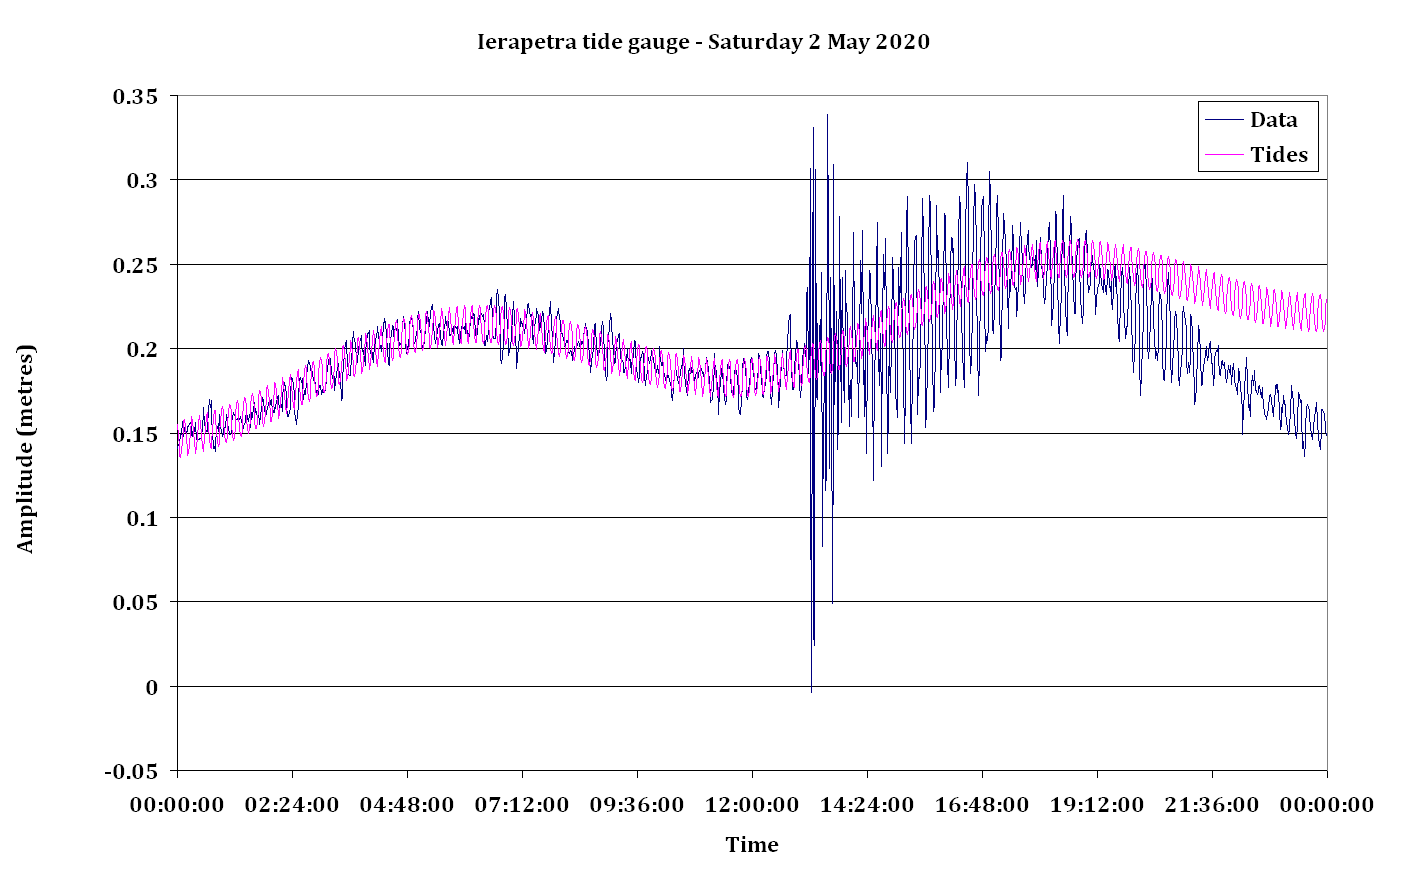
Figure 6: Retrieval of the tides. For the daily component (amplitude 25 mm) the minimisation between observations and model is made in the time window that precedes the earthquake 00:00 – 12:50. The estimation of the short term component is made in the time window 11:00 – 12:36, as the structures of the waves is stable during that time window with amplitude 11.3 mm and period 948 s.
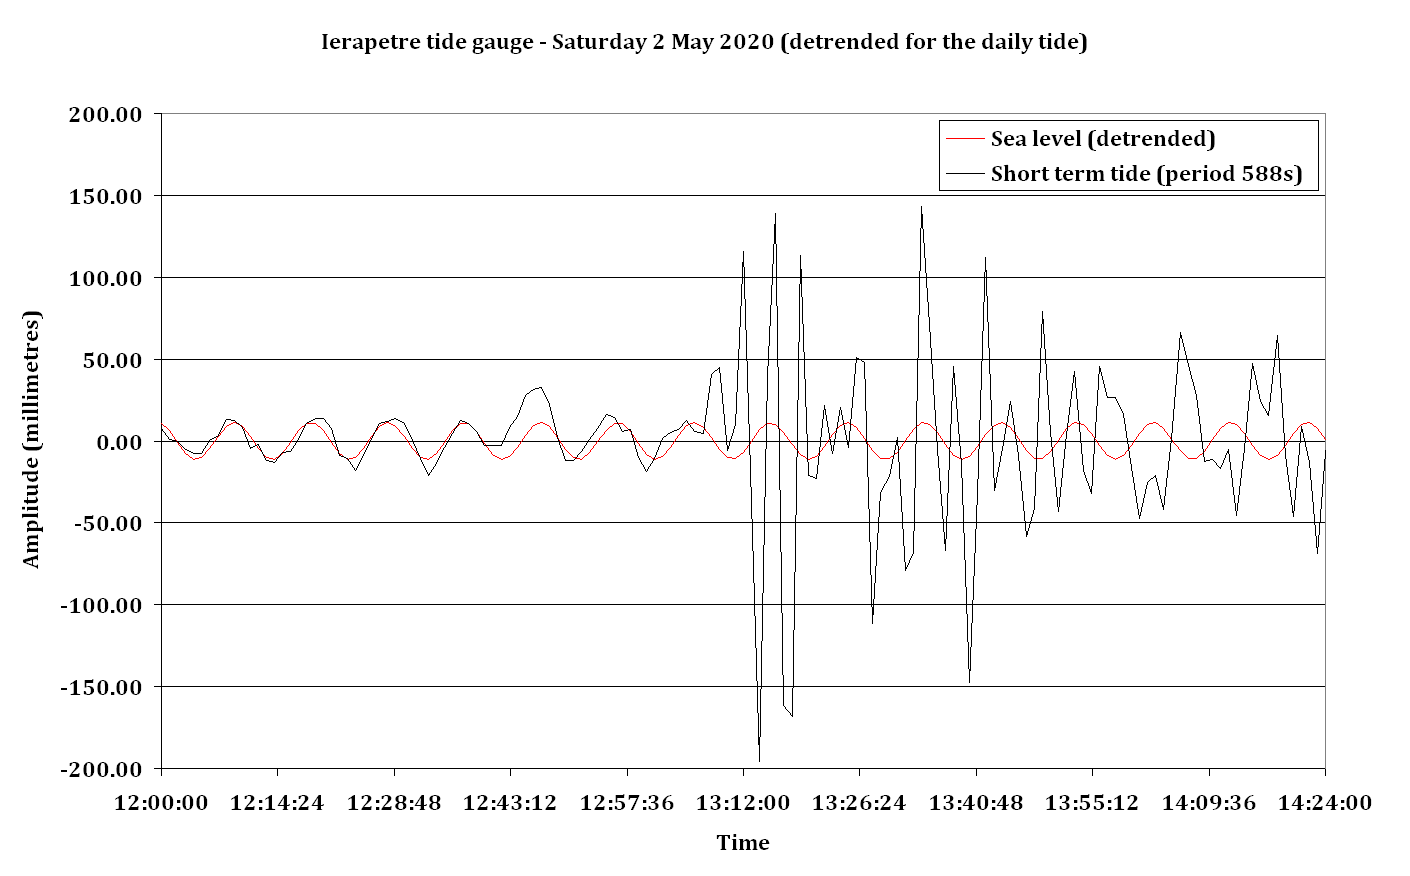
Figure 7: Detail of the tide gauge recording after removal of the daily component of the tides. The short term component is not removed but the best fitting model (tuned for the time intervan 11:00 – 12:36) is plotted. We see that the first sample detecting the tsunami signal is the sample of 13:08 UTC wich a movement of the sea towards up of 40 mm with respect to sample acquired one minute before.
In the south of Crete there are other tide gauge reported in literature, PaleoChora in southwester Crete and Gadvos belonging to the hellenic navy, but we could not find data from those stations for this event.
Model of tsunami calculated with CLIONA (©CEA/DASE) by Simon Bufféral
The waveform is extracted from the model at six stations: two of them real, IPRT (Ierapetra, NOA-04) and PLCR (Paleochora), see details above, and four fictitious, AGGL (Agia Galini), ARVI (Arvi), CRUS (Chrysi island), GDRS (Goudouras). Their coordinates are:
- AGGL: 24.693°E, 35.094°N
- ARVI: 25.455°E, 34.986°N
- CRUS: 25.701°E, 34.878°N
- GDRS: 26.091°E, 35.009°N
- IRPT: 25.742°E, 35.006°N
- PLCR: 23.685°E, 35.227°N
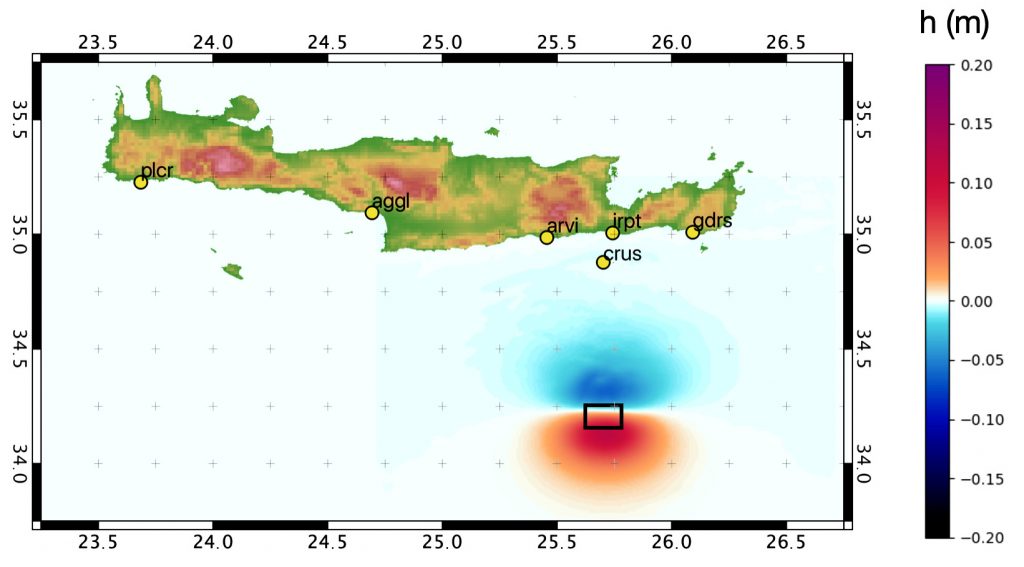
Figure 8: Location of the real (IRPT, PLCR) and fictitious tide gauges. The black rectangle is the location of the fault used in the model, and the motion of the sea is represented at the time 0.
We made two tests, with 10 and 17 km for the centroid depth and all parameters identical in the two models. The parameters of the modelled fault are the following:
- Angles of the fault: azimuth 270°, dip 10°, rake 90°
- Size of the fault: length 20 km, width 10 km
- Slip: 1.4 m
- Location of the centroid: 25.70°, 34.20°, 10 km (test2) or 17 km (test3)
Here we use the EMODNED bathymetry and no correction at whallow depth in the vicinity of the shores (and the tide gauges).
 Figure 9: Modelled propagation of the tsunami during the first 60 mn (case = test2)
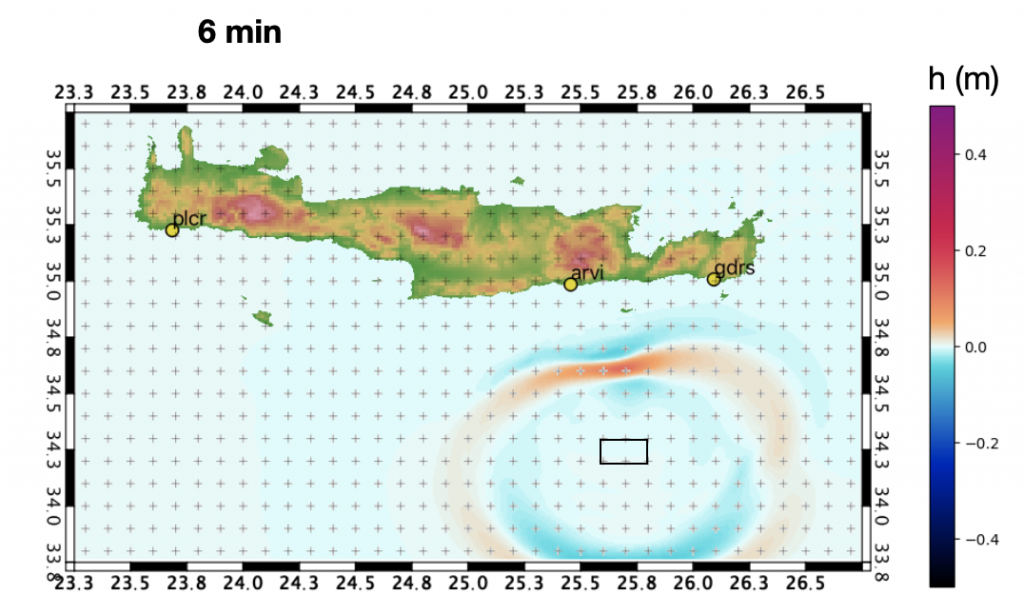
Figure 10: Snapshot at T = 6 mn
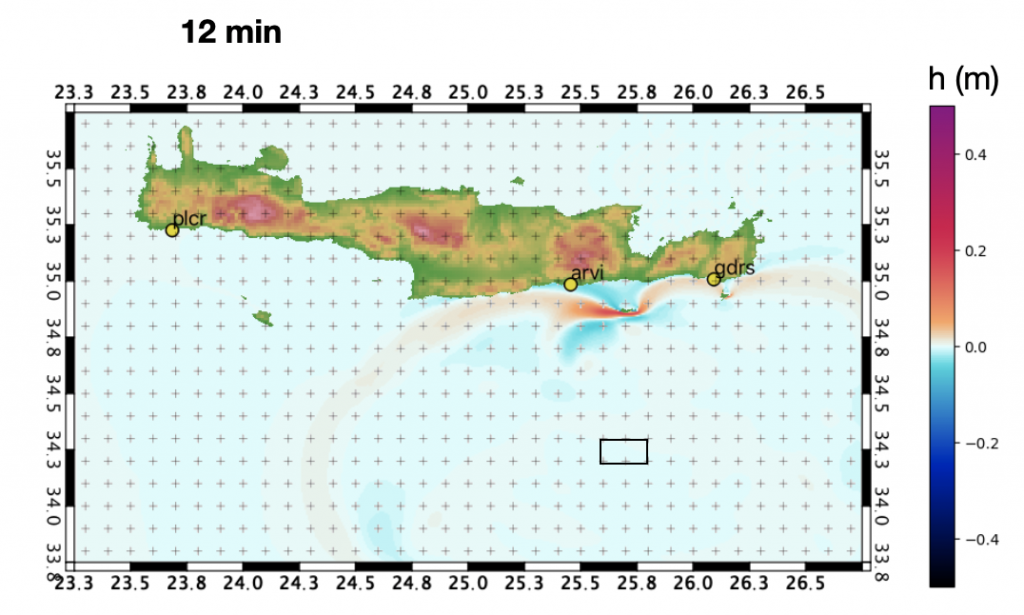
Figure 11: Snapshot at T = 12 mn
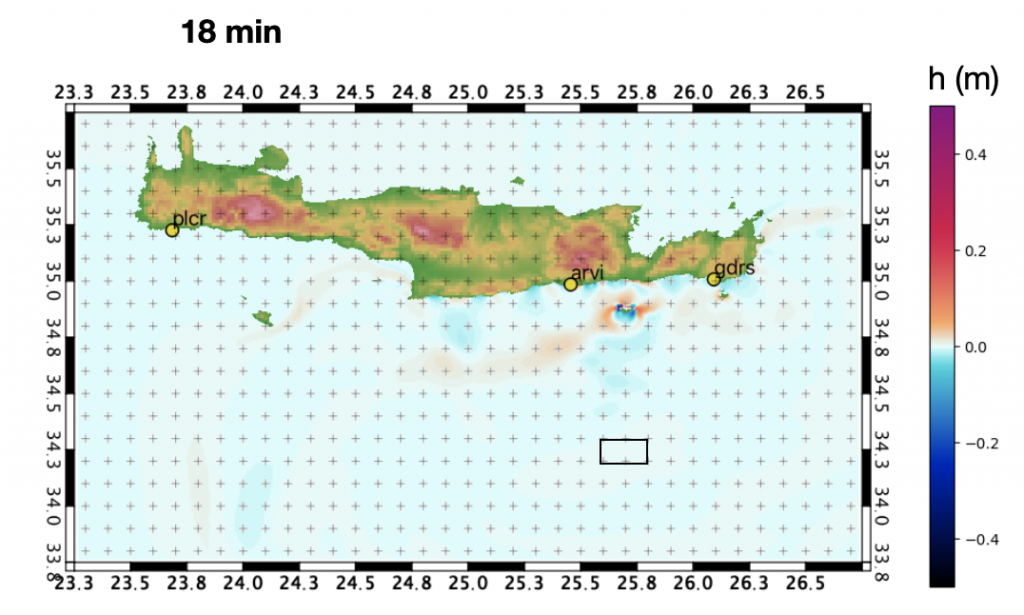
Figure 12: Snapshot at T = 18 mn
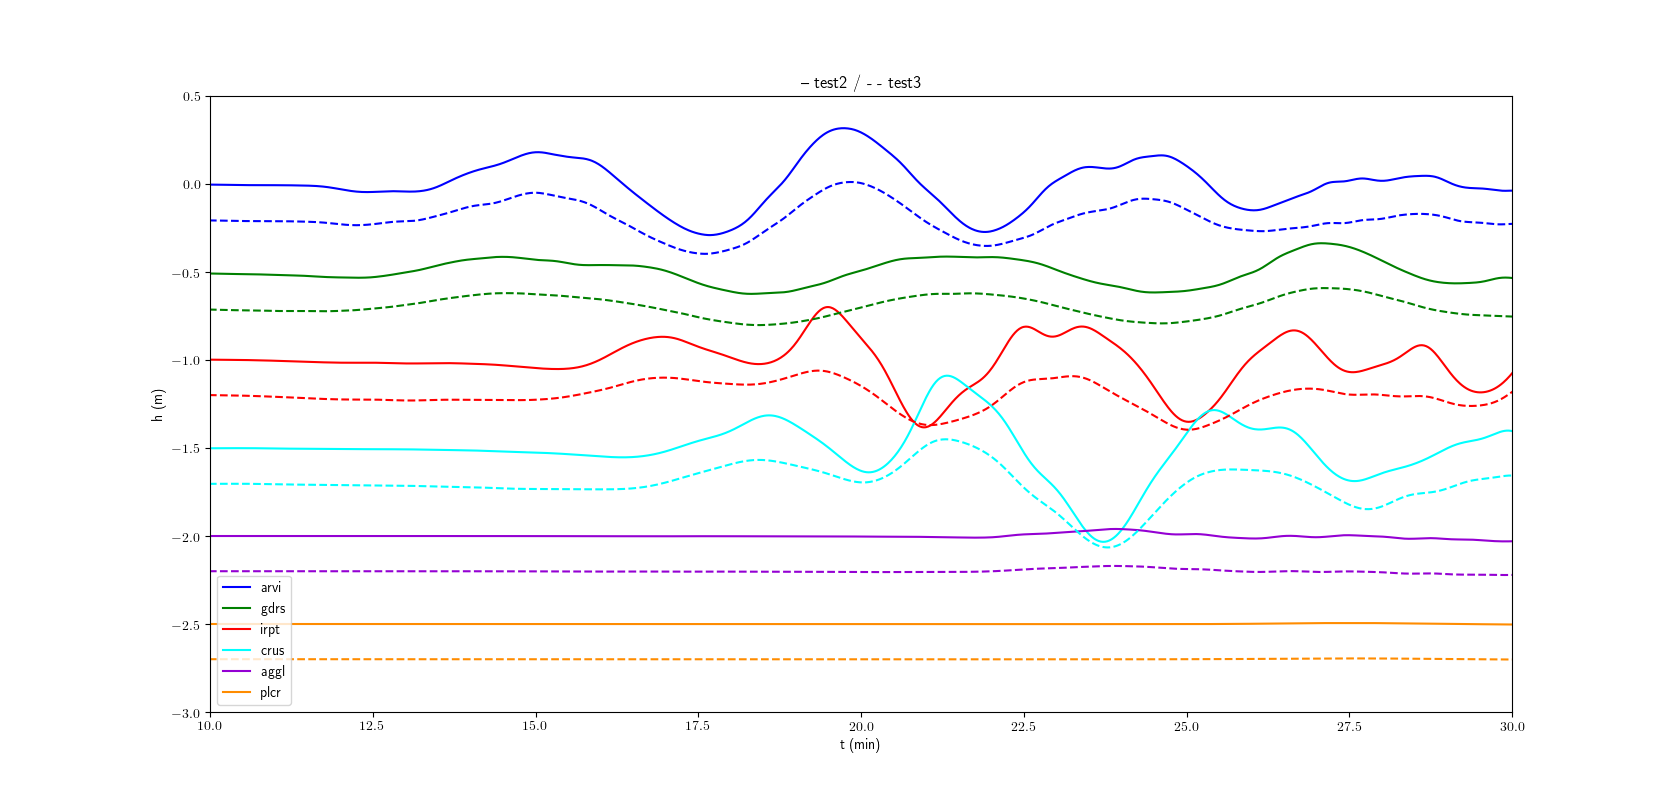
Figure 13: Modelled wave at the six stations and for the two cases: solid lines = test2 (centroid at 10 km), broken lines = test 3 (centroid at 17 km).
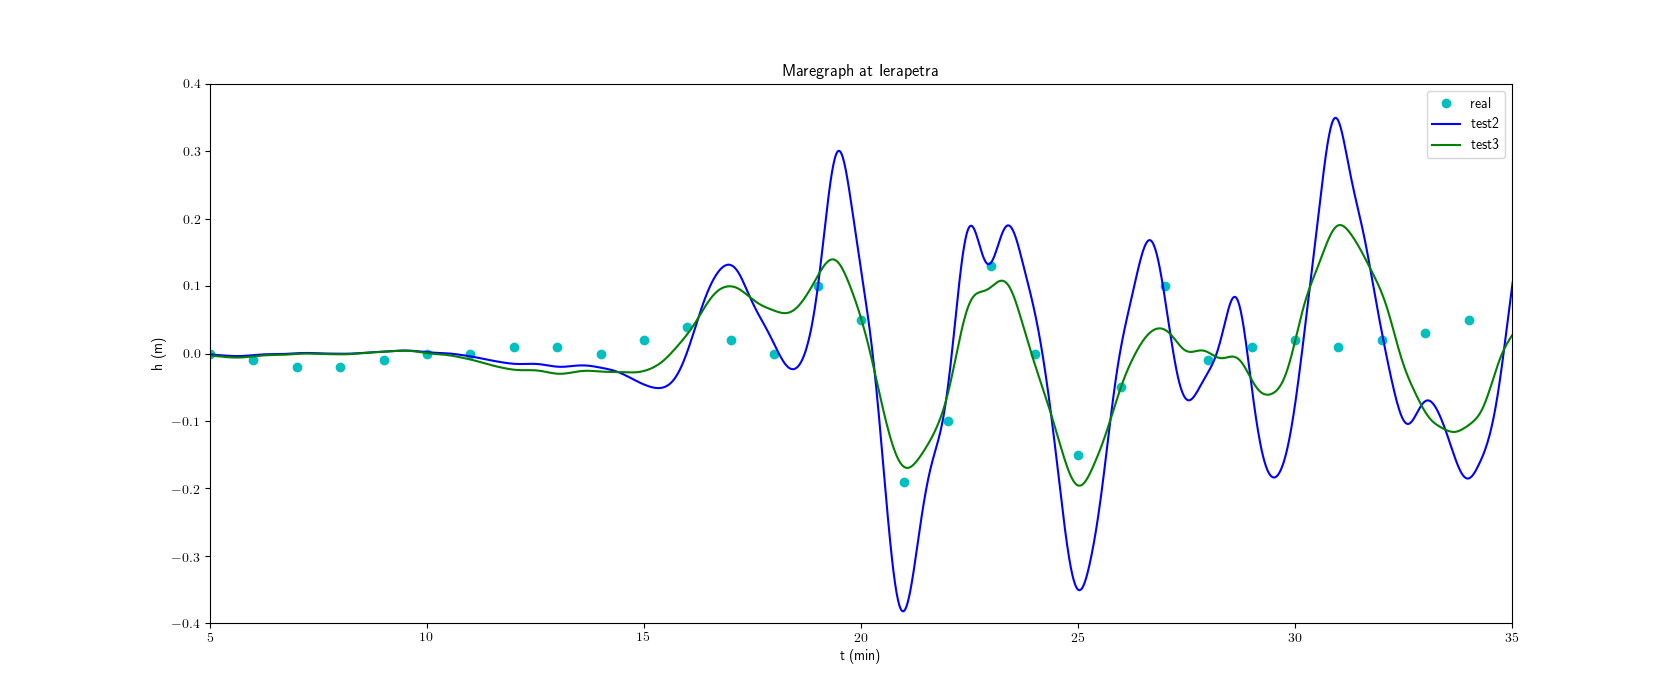
Figure 14: Observations and models (test 2 and test 3) at the tide gauge of Ierapetra.

Figure 15: We noticed that the best fit between the modelled and observed signal is obtained by adding 90 s to the prediction of the model. In other words our model arrives 90 s earlier that the actual observations. This is when we align the major peaks. When we consider just the start of the tsunami wave the shift can be 60 s only.
Second run of models (5 may 2020)
Here we run a model (test4) that respects the depth and dip angle of the G-CMT, and we compare it to the model test3 evaluated previously. The parameters are the following:
- Angles of the fault: azimuth 270°, dip 10° for test3 and 22° for test4, rake 90°
- Size of the fault: length 20 km, width 10 km
- Slip: 1.4 m
- Location of the centroid: 25.70°, 34.20°, 17 km (test3) and 12 km (test4)
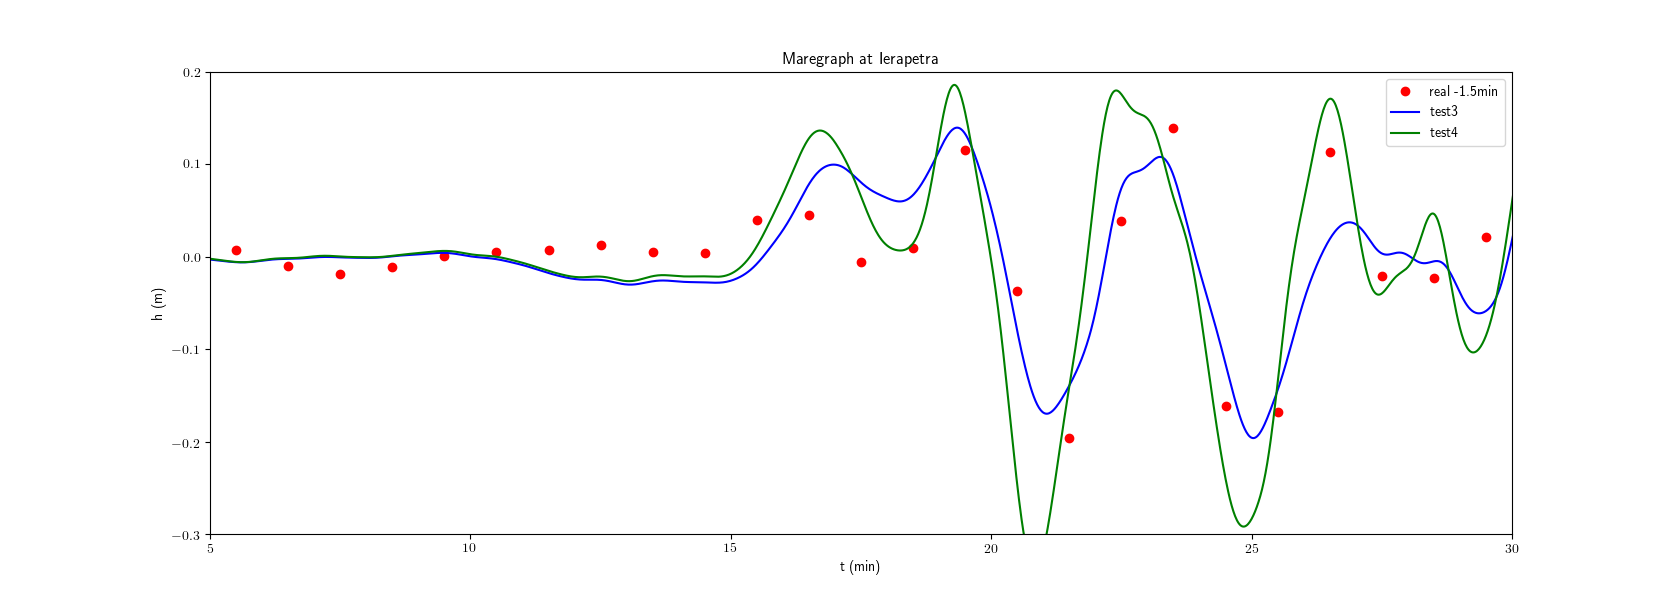
Figure 16: Model (test4) respecting the specification of th G-CMT (for the dip angle and the depth) compered to the model test3
Some preliminary considerations:
- Not all (relatively frequent) earthquakes of this magnitude occuring to the south of Crete produce a tsunami.
- This earthquake produced a tsunami because the fault is shallow.
- The tsunami is detected by the tide gauge of Ierapetra et 13:08 thus 17 mn after the earthquake.
- The model predicts an arival time a bit earlier (60 to 90 s) possibly because of the unaccurate bathymetry near the coast.
- The first motion of the tsunami wave recorded at Ierapetra is towards up.
- The amplitude of the modelled wave depends on the depth of the fault.
- There are papers in literature that discuss the various categories of earthquakes occuring to the south of Crete, for example the paper of Taymaz et al., 1990.
Bibliography
- Taymaz T., Jackson J., Westaway R., 1990. Earthquake mechanisms in the Hellenic Trench near Crete, Geophys. J. Int., 102, 695-731, doi: https://doi.org/10.1111/j.1365-246X.1990.tb04590.x
- Kreemer C., Chamot‐Rooke, N., 2004. Contemporary kinematics of the southern Aegean and the Mediterranean Ridge, Geophys. J. Int., 157, 3, (1377-1392), (2004), doi: https://doi.org/10.1111/j.1365-246X.2004.02270.x
To know more:
- Visit the WhaTsun page and learn more on tsunami earthquakes in Greece and the western Hellenic arc