
The statistics below are those of early november 2019
Click on the figures to enlarge

Figure 1. Daily number of visitors. The peaks are in september (during the CRLSchools) and in june (during the coordination meetings of the NFO).
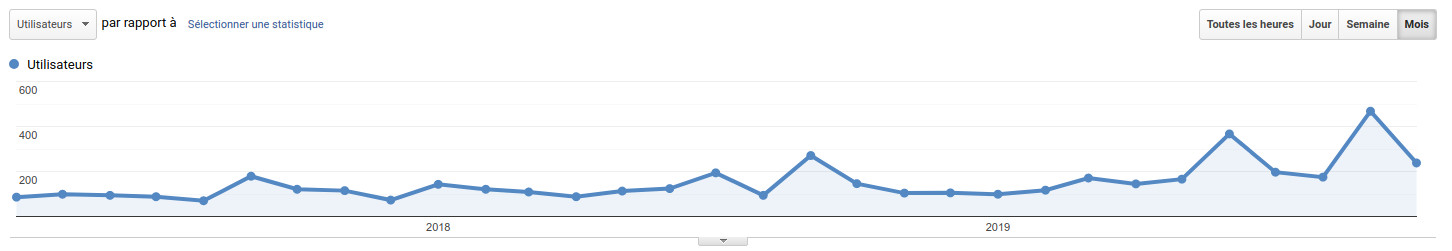
Figure 2. Monthly number of visitors.
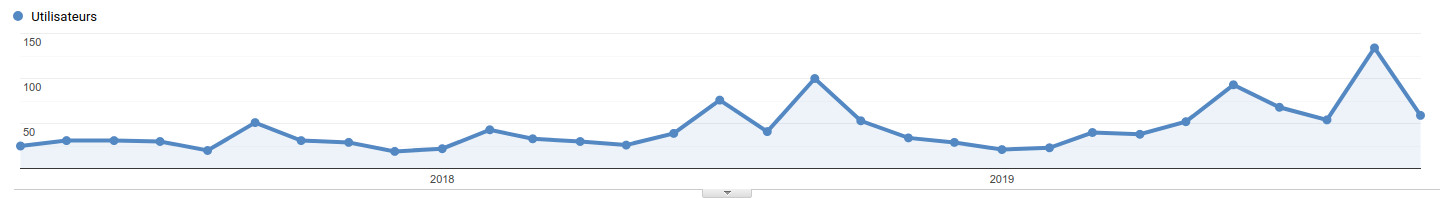
Figure 3. Evolution of the monthly number of returning visitors. The returning visitors represent 16.9% of the total number of visitors. Not considering the peaks of June and September (see Fig. 1), there is a positive long term trend passing from ~30 returning visitors/month in early 2017 to ~60 returning visitors/month in late 2019. The present (november 2019) 60/month might be a reasonably good measurement of the current number of routine users of data and products distributed through the CRL web portal (see pages most visited in Fig. 5).
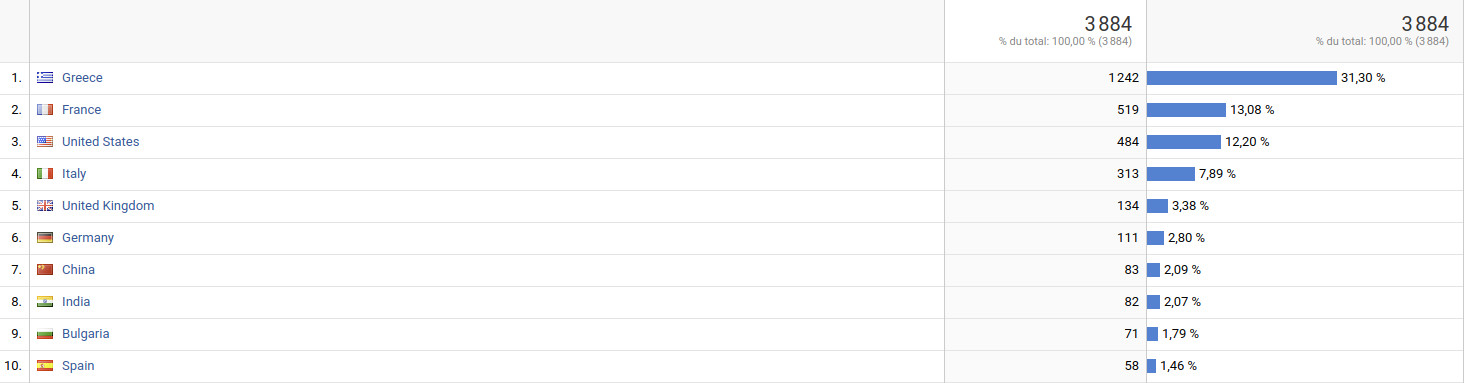
Figure 4. Country of the visitor. Greece is by far the top user of the CRL NFO web portal.
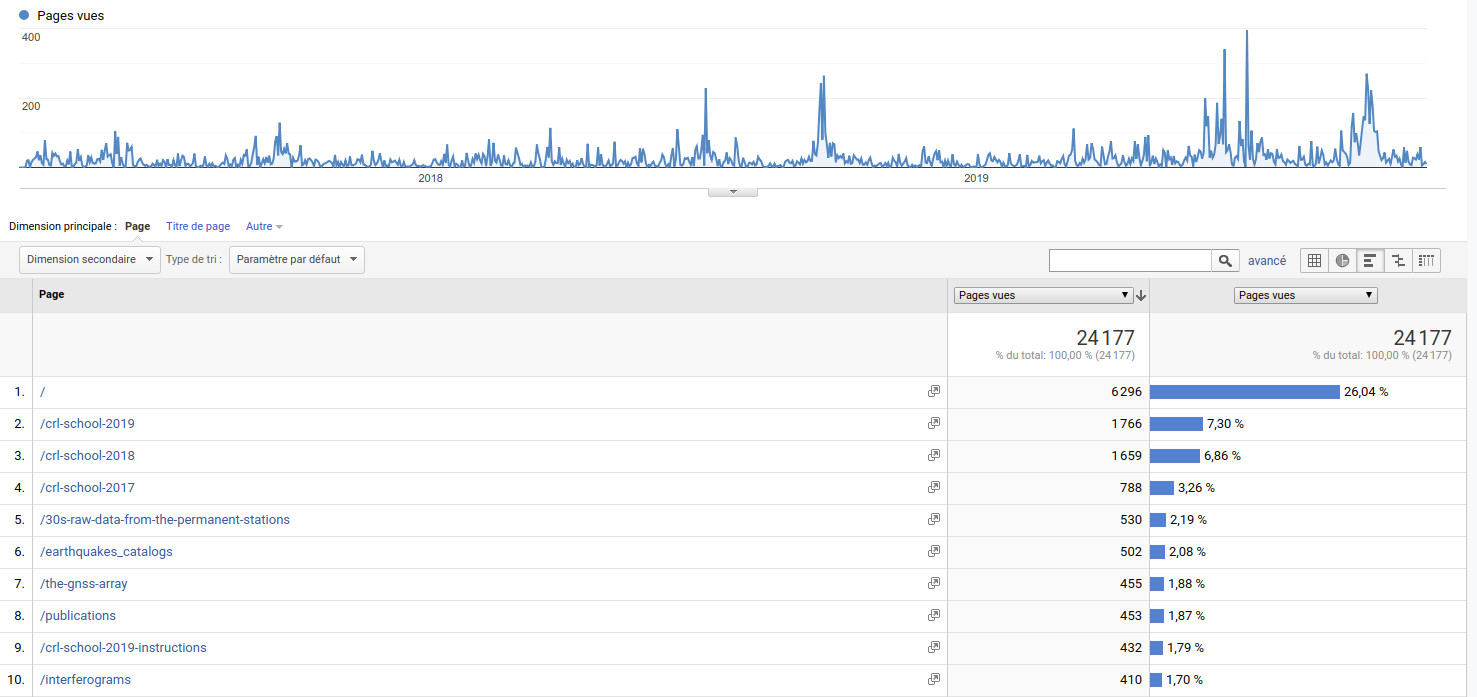
Figure 5. Pages most visites. The home page http://crlab.eu is the most visited with 26%. The three CRLSchools 2019, 2018 and 2017 gather in total 17.4%. The data/products pages most visited are those with 30s GNSS data, earthquakes catalogs, and interferograms.

Figure 6. Duration of the session. Apart the very short visits, the peak visit time is in the range 3-10mn.
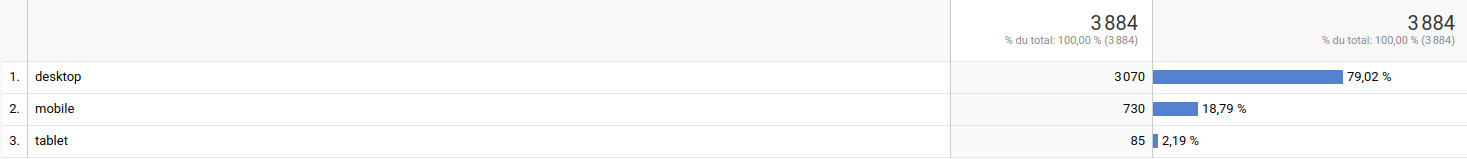
Figure 7. Type of interface. The CRL portal is compatible with smartphones and tablets. This is useful in particular to navigate whith the GPS of the smartphone to the stations in the field (see for example here for navigation to the seismic stations). The connections with smartphones account currently for ~19%.