A Javad GPS receiver was operated on board of the Aegeo R/V on October 8 and 9 2002.
- October 8: 9:53 UT -> 23:59 UT – RINEX 1s sampling rate – KML trajectory (pseudo-range dual-iono-free) – KML trajectory (phase)
- October 9: 00:01 UT -> 09:59 UT – RINEX 1s sampling rate – KML trajectory (pseudo-range dual-iono-free) – KML trajectory (phase)
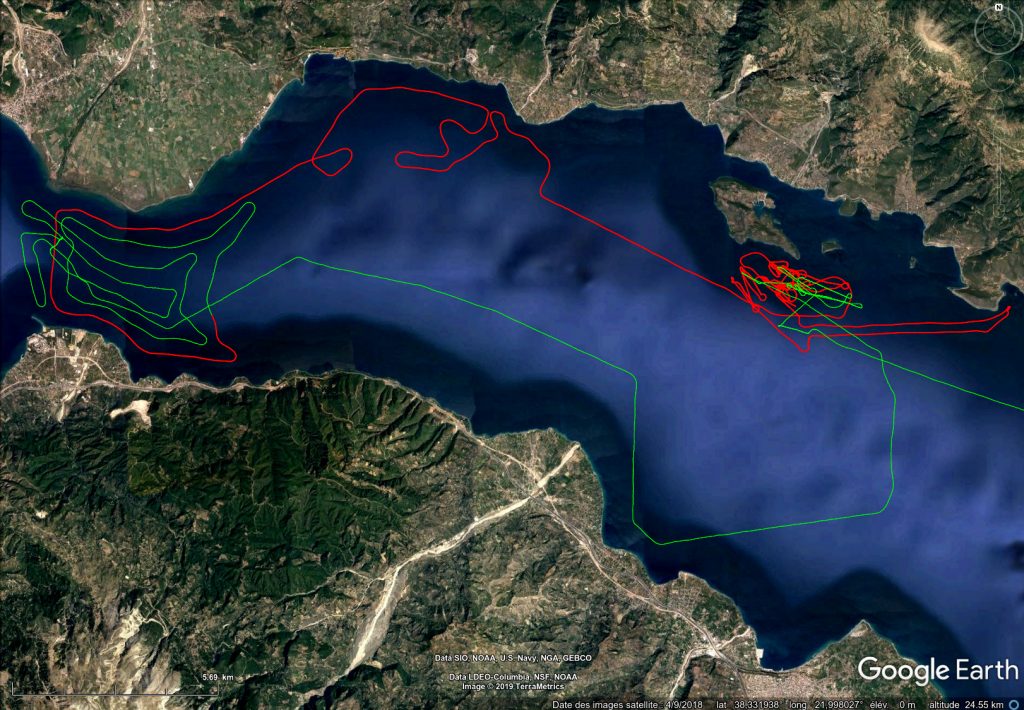
Figure 1: Trajectory of the R/V Aegeo, October 8 in red, October 9 in green

Figure 2: Two different navigation solutions from GIPSY Oasis 6.4. In red « dual-iono-free » solution (using P1 and P2), in yellow C1 solution of the programme pr2p.pl